




Pasadena Clean Energy Tracker
Key Metrics for Achieving Pasadena's Carbon-Free Future
PWP is committed to implementing Resolution 9977, which was approved by the Pasadena City Council on January 30, 2023, and sets a goal to source 100% of Pasadena’s electricity from carbon-free resources by the end of 2030 while optimizing for affordability, rate equity, stability, and reliability of electricity. Resolution 9977 has been incorporated into PWP’s 2023 Integrated Resource Plan (IRP), which was adopted by the City Council in December 2023 and was approved by the California Energy Commission. The 2023 IRP accelerates California’s 2045 clean energy target by 15 years and demonstrates an ambitious approach to achieving Pasadena’s carbon-free future.
Since adopting the 2023 IRP, PWP continues to develop its clean energy portfolio and implementing the Optimized Strategic Plan (OSP) to achieve the 2030 goal. The OSP was approved and adopted by City Council in December 2025. The OSP Progress Reports and all supporting materials can be viewed here.
The Clean Energy Tracker was developed in collaboration with Energy and Environmental Economics, Inc., a recognized leader in clean energy policy to establish key metrics to track PWP's progress toward achieving its clean energy goals. PWP will continue to evaluate the relevance of key metrics and update the tracker, as needed, to best report progress updates and new information related to Pasadena's transition to clean energy.
Key metrics include:
- Progress toward Senate Bill 100's 2045 clean energy target
- Progress toward achieving the carbon-free goals of Resolution 9977
- Growing community adoption of distributed energy resources and zero emission vehicles
- Energy efficiency efforts
The tracker is a developing product and will be enhanced in phases. Public opinion matters to us, and we invite you to submit your comments and suggestions to WPD_IRP@cityofpasadena.net.
A definition table appears at the bottom of this page for reference.
The depicted metrics are based on forecasts and subject to change at any time to reflect new or updated information, including but not limited to, revised load and demand forecasts, new or amended contracts, changes in customer electric usage and other conditions and trends. Periodic updates will be made as new information becomes available, but may vary by metric depending on relevance, methodology, or availability of data.
Progress Toward 100% Carbon-Free
Electricity by the end of 2030
Forecast for Year 2031 as of October 26, 2026

| Resources - Owned/Contracted | Resources - In Progress | Total | |
| ANNUAL CARBON-FREE METRIC Senate Bill 100 100% Renewable and Zero-Carbon by 2045 |
83% | 42% | 125% |
| HOURLY CARBON-FREE METRIC 24/7 Hourly Matching Average Hourly Carbon-Free |
76% | 19% | 95% |
Residential Electric Services Rates Comparison
Updated October 2026
Pasadena is committed to remaining an affordable and equitable publicly owned electric service provider in alignment with Resolution 9977 stated goals. A rate study is currently being conducted; more information on the process can be found at our Electric Rate Study page. Customer bills vary based on type of customer, usage, incentives, time of year, and even the time of day for some. The graphic below is one user profile and bill comparison between Pasadena and our neighboring service providers.

| Utility | Monthly Bill |
| Southern California Edison | $161.52 |
| Glendale Water & Power | $163.53 |
| Los Angeles Department of Water and Power | $139.71 |
| Burbank Water and Power | $133.59 |
| Pasadena Water and Power | $114.67 |
Amounts represent a single‑family residential bill at 500 kWh/month. Calculated using published non-time‑of‑use rate schedules. Excludes taxes and non-bypassable surcharges. SCE includes wildfire insurance fund charges. Source: publicly available utility rate schedules, October 2026.
Table of Resources Active in 2030
| Name of Generation Resource | Technology Type | Start and End Date of Contract | Contract Capacity ("MW") | Expected Annual Production ("MWh") |
| Windsor Reservoir | Photovoltaic Solar | 5/31/2011- 5/30/2031 | 0.664 | 873 |
| Columbia 2 | Photovoltaic Solar | 12/10/2014 - 12/9/2034 | 2.6 | 6,680 |
| Kingbird | Photovoltaic Solar | 4/30/2016 - 12/31/2035 | 20 | 58,000 |
| Big Sky Summer | Photovoltaic Solar | 6/30/2016 - 12/31/2041 | 6.5 | 15,500 |
| Antelope Big Sky Ranch | Photovoltaic Solar | 8/19/2016 - 12/31/2041 | 6.5 | 15,500 |
| Grace Orchard | Photovoltaic Solar | 12/1/2027 - 11/30/2047 | 50 | 144,540 |
| Bonanza | Photovoltaic Solar + Storage | 1/1/2029 - 12/31/2048 | 105 of Solar 55 of Storage |
303,500 |
| Wind Resource II | Land-Based Wind | 7/29/2025 - 7/28/2035 | 20 | 60,000 |
| Glenarm Battery Energy Storage System (BESS) | Standalone 4-hour BESS | 7/1/2027 - 6/30/2040 | 25 | N/A |
| Coso | Geothermal | 1/1/2027 - 12/31/2041 | From 1/1/2027 - 12/31/2036: 10.33 / From 1/1/2037 - 12/31/2041: 20.37 |
90,490 / 178,400 |
| Geysers | Geothermal | 1/1/2027 - 12/31/2041 | 25 | 194,900 |
| Azusa Hydro | Small Hydroelectric | Owned Resource | 3 | currently offline - TBD |
| Hoover Dam | Large Hydroelectric | 1/1/1987 - 9/30/2067 | 20 | 45,500 |
| Palo Verde | Nuclear | 1/1/1986 - 5/31/2045 | 9.9 | 83,000 |
| Magnolia Power Project | Natural Gas | 9/22/2005 -6/30/2036 | 18 | 85,000 |
| Glenarm Power Plant | Natural Gas | Owned Resource | 198 (combined) | 42,000 |
*Note: MWh calculations are forecasted based on historical performance and may fluctuate throughout the years.
Progress Toward Meeting the Senate Bill 100 target
100% Renewable and Zero-Carbon by 2045
Forecast as of October 2026

| Year | Resources - Owned/ Contracted | Resources - In Progress | TOTAL |
| 2025 | 61% | 0% | 61% |
| 2026 | 64% | 0% | 64% |
| 2027 | 68% | 20% | 88% |
| 2028 | 81% | 22% | 103% |
| 2029 | 80% | 43% | 123% |
| 2030 | 91% | 42% | 133% |
| 2031 | 83% | 42% | 125% |
Annual Carbon-Free Metric - Meeting California Regulatory Requirements
Tracks progress in meeting California's Senate Bill 100 (2018) mandate, which requires that eligible renewable energy resources and zero-carbon resources supply 100% of retail sales of electricity to California end-use customers by December 31, 2045.
Calculation Methodology for Annual Carbon-Free Metric:
- Numerator: Forecasted Annual Carbon-Free Generation (in MWh)
- Denominator: Forecasted Annual Retail Sales (in MWh)
Progress Toward 100% Average Hourly Carbon-Free
24/7 Hourly Matching
Forecasted as of October 2026

| Year | Resources -Owned/Contracted | Resources - In Progress | Total |
| 2025 | 34% | 34% | |
| 2026 | 34% | 34% | |
| 2027 | 54% | 15 | 69% |
| 2028 | 64% | 9% | 73% |
| 2029 | 63% | 20% | 83% |
| 2030 | 77% | 16% | 93% |
| 2031 | 76% | 19% | 95% |
Hourly Carbon-Free Metric - Delivering Carbon-Free Energy on an Hourly Basis
Shows PWP's progress toward matching electricity demand with carbon-free energy on an hour-by-hour basis. While the Annual Carbon-Free Metric considers the total amount of carbon-free generation in PWP's portfolio over the entire year, the Hourly Carbon-Free Metric does not count carbon-free generation if it exceeds PWP's load. Hourly Carbon-Free Metric is an hourly metric and differs from Annual carbon-Free Metric, which is based on the annual reporting requirements under Senate Bill 100.
It should be noted that even if Hourly Carbon-Free Metric is forecasted to achieve 100%, it is possible that periods may exist during which one or more Glenarm gas turbines are dispatched by the California Independent System Operator for certain hours due to grid system emergencies, or to ensure local reliability in order to prevent rolling outages.
Calculation Methodology for Hourly Carbon-Free Metric:
Matches forecasted carbon-free generation with forecasted load on an hourly basis. Generation that exceeds hourly forecasted load is not included in the average calculation.
- Numerator: Forecasted carbon-free generation matched to hourly load forecast (in MWh, capped at hourly load forecast for each hour)
- Denominator: Forecasted annual load (in MWh)
Distributed Battery Energy Resources in Pasadena
(kW)

| Year | Batteries |
| 2019 | 173 |
| 2020 | 461 |
| 2021 | 686 |
| 2022 | 894 |
| 2023 | 1,082 |
| 2024 | 1,341 |
| 2025 | 1,860 |
| 2026 | 2,649 (1,860 previously installed batteries + 789 current year additions to date) |
Battery installations in Pasadena
Shows the cumulative kilowatt total of battery installations made by residential and commercial customers within Pasadena.
Distributed Solar Energy Resources in Pasadena
(kW)

| Year | Solar (kW) |
| 2008 | 126 |
| 2009 | 477 |
| 2010 | 1,134 |
| 2011 | 1,471 |
| 2012 | 4,300 |
| 2013 | 4,766 |
| 2014 | 5,488 |
| 2015 | 7,217 |
| 2016 | 8,787 |
| 2017 | 9,966 |
| 2018 | 11,280 |
| 2019 | 12,477 |
| 2020 | 15,070 |
| 2021 | 19,177 |
| 2022 | 23,800 |
| 2023 | 26,154 |
| 2024 | 29,979 |
| 2025 | 32,409 |
| 2026 | 34,036 (32,409 previously installed solar + 1,627 current year additions) |
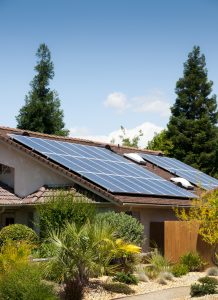
Solar installations in Pasadena
Similar to the Solar installation graph, this graph depicts cumulative solar installations in Pasadena through 2025. The 33,552 kilowatts shown largely represents PWP residential and commercial customers.
It is expected the distributed energy resource installations in Pasadena will increase dramatically in the future as PWP continues to implement the 2023 IRP.
Additional Decarbonization Efforts
Energy Efficiency Savings (MWh) Residential & Commercial Programs
Cumulative savings represent all PWP energy efficiency/Public Benefits programs including rebates, direct installations, and low-income assistance.

| Year | Cumulative Energy Efficiency Savings (MWh) for Residential and Commercial Programs |
| 2006 | 4,501 |
| 2007 | 4,501 |
| 2008 | 8,739 |
| 2009 | 16,902 |
| 2010 | 46,966 |
| 2011 | 61,565 |
| 2012 | 73,809 |
| 2013 | 87,145 |
| 2014 | 104,041 |
| 2015 | 122,702 |
| 2016 | 140,143 |
| 2017 | 159,562 |
| 2018 | 184,510 |
| 2019 | 200,899 |
| 2020 | 217,196 |
| 2021 | 229,491 |
| 2022 | 239,403 |
| 2023 | 250,912 |
| 2024 | 260,970 |
| 2025 | 268,785 |
Energy Efficiency Efforts
Measures the cumulative energy savings achieved through PWP's energy efficiency programs and public conservation outreach efforts. Additional information about these programs is available in Energy Efficiency in California's Public Power Sector (2022), the Annual Report published by the California Municipal Utilities Association.
Additional Decarbonization Efforts
Zero Emission Vehicles Registered in Pasadena

| Year | ZEVs Registered in Pasadena |
| 2018 | 3,874 |
| 2019 | 4,788 |
| 2020 | 5,449 |
| 2021 | 6,815 |
| 2022 | 8,857 |
| 2023 | 11,474 |
| 2024 | 13,986 |
| 2025 | 16,141 |
Zero Emission Vehicles Expansion Efforts
Depicts the number of Zero Emission Vehicles ("ZEV") registered in Pasadena according to the Department of Motor Vehicles, and includes City fleet vehicles. The California Energy Commission defines ZEV to include Battery Electric, Plug-in Hybrid, and Hydrogen Fuel Cell Vehicles.
Definitions Table
| Acronym | AKA | Definition |
| DER | Distributed Energy Resource | DER refers to often smaller generation units that are located on the consumer's side of the meter, such as rooftop solar photovoltaic units and battery storage. |
| Load | Energy Demand | Total amount of electricity required to serve customers at any given moment. This is measured in MWh. |
| MW | Megawatt | The amount of electricity that can be generated in an instant. |
| MWh | Megawatt-hour | A megawatt-hour is a unit of energy that measures the amount of electricity that can be stored or delivered over a period of time. It's equivalent to 1,000 kilowatts of electricity used continuously for one hour. For example, if a 1 MW solar array runs continuously at capacity for one hour, it would produce 1 MWh of electricity. |


